The monitor
canair monitor is canair's main screen. It polls the ECUs you choose and shows their decoded
signals live, in place, while the car drives, charges or sleeps. From the same screen you record
the session, label it, edit and verify signal definitions, open a diagnostic session and, with
--actuate, switch outputs. Most work with canair starts here.
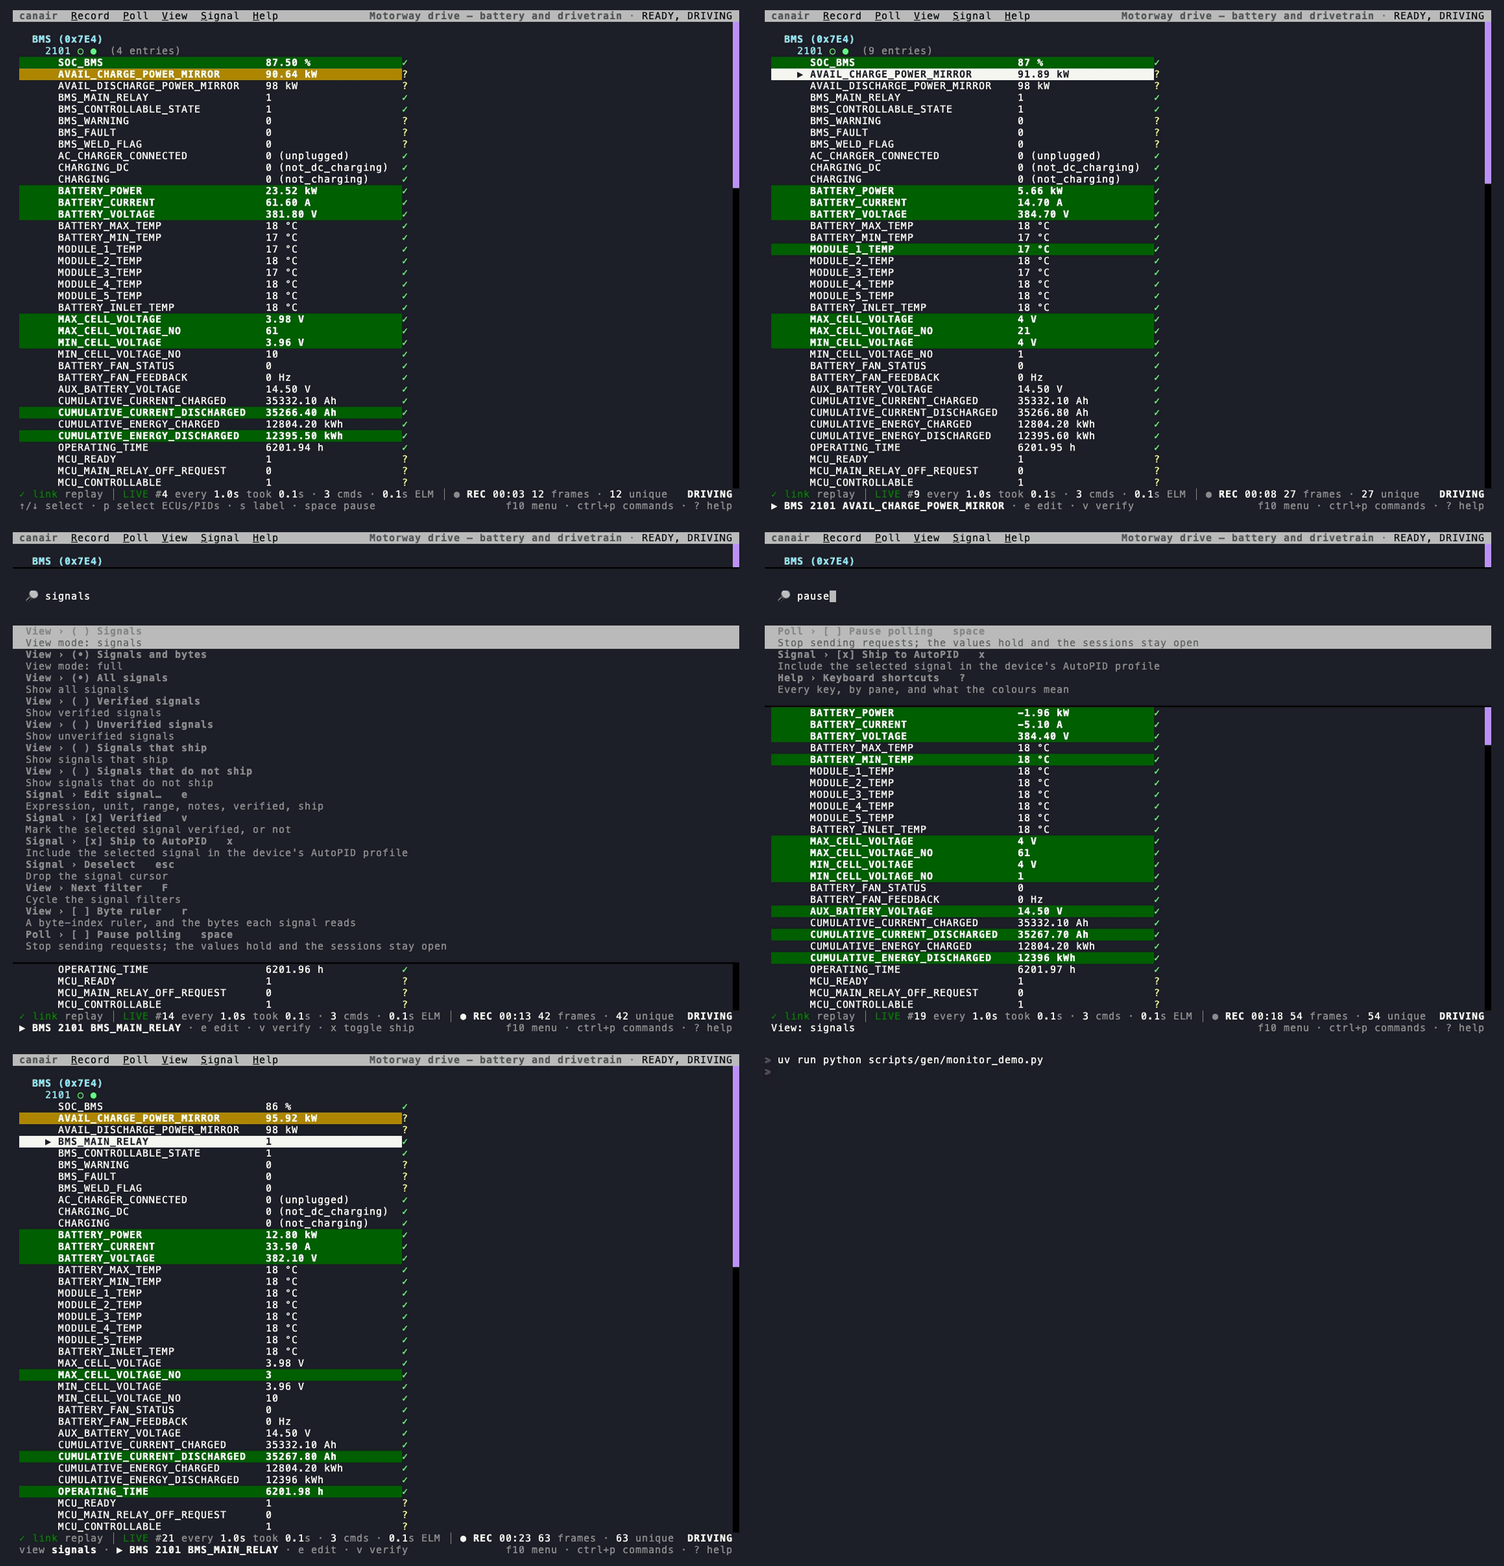
The recording above is the real monitor. It replays a motorway drive that the bundled Ioniq
profile recorded on the road, so it needs no car (see
Documentation screenshots). Its status line says replay where a
real session names the device and the transport.
Start it
canair monitor                          # pick ECUs, then PIDs, from a list (on a terminal)
canair monitor BMS:2101                 # one PID
canair monitor "BMS:2101 VCU:2101 MCU:2102"   # several ECUs at once
canair monitor @charging                # a saved group (see `canair groups`)
canair monitor BMS:2101 --save --label "Motorway drive" --state "READY, DRIVING"   # record it
The selectors are the query mini-language that canair read
also takes. canair monitor --help lists every flag.
The screen
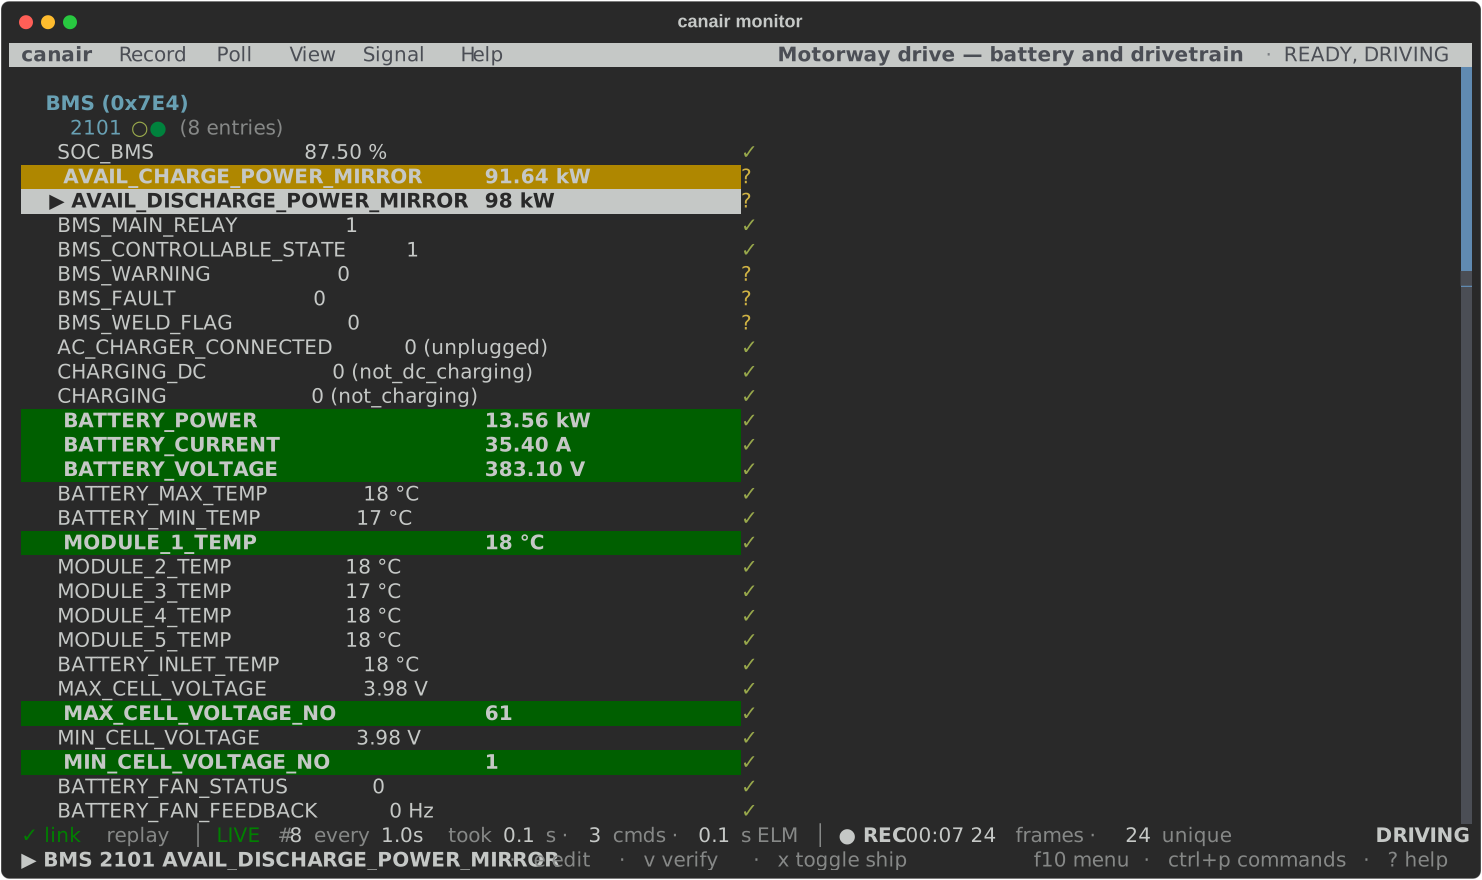
From top to bottom:
- The menu bar. It has every command, in the menus Record, Poll, View, Signal, Actuators (with
--actuate) and Help. On its right is the label of the recording, its vehicle states and the profile. - The values. Each ECU, each PID and its decoded signals, with a
✓for a verified signal and a?for an unverified one. The values update in place. A refresh never moves the scroll position, so the value that you read stays where it is. In the full view, the raw payload is below the signals, with each byte colored by what reads it. - The status line. Four zones, always in the same order. See The status line.
- The bottom line. The last message, or the selected signal and its keys. On the right are
the three keys that reach every command:
f10 menu · ctrl+p commands · ? help.
The colors of the values and the bytes:
- Green: a verified signal, or a byte that a verified signal reads.
- Yellow: an unverified signal, or a byte that an unverified signal reads.
- Grey: a byte that no signal reads.
- Muted grey-blue: the declared support map of the PID (layout bytes, not data).
- A bright background: the value or the byte changed in this poll cycle.
Press ? for every key, by pane, and the color legend.
Find a command
You do not have to learn the keys first. There are three ways to every command:
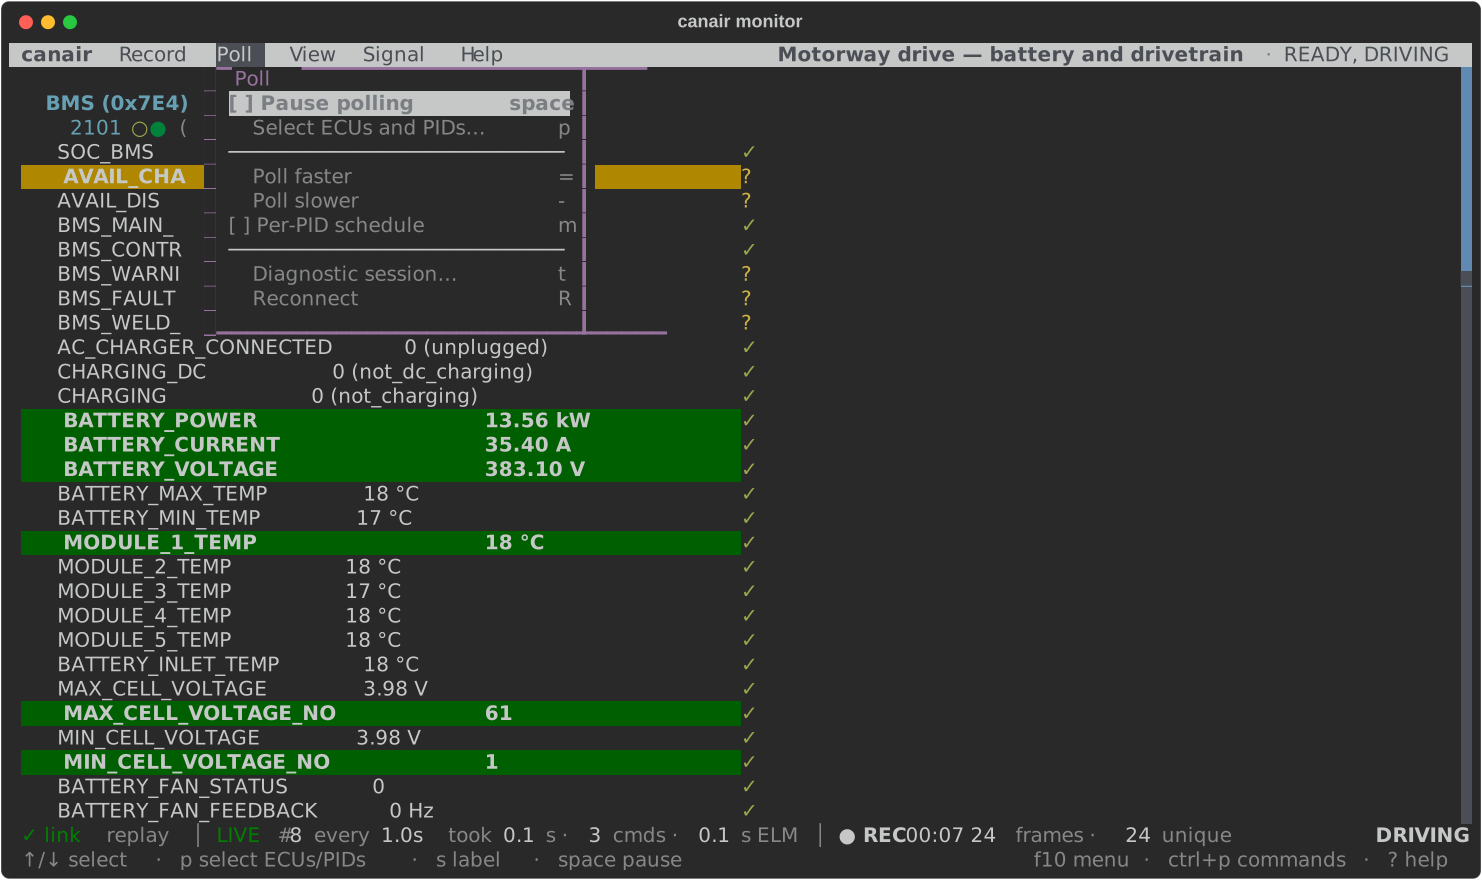
- The menu bar. Press
f10for the first menu, or click a title. With "Option as Meta" (or the equivalent) on in your terminal,altand the underlined letter opens one menu.←and→move between menus,enterruns an item,esccloses the menu. Each item shows its key on the right,[x]for a setting that is on, and(•)for the chosen view or filter. An item that cannot run now is greyed out. If you run it anyway, the bottom line says why.
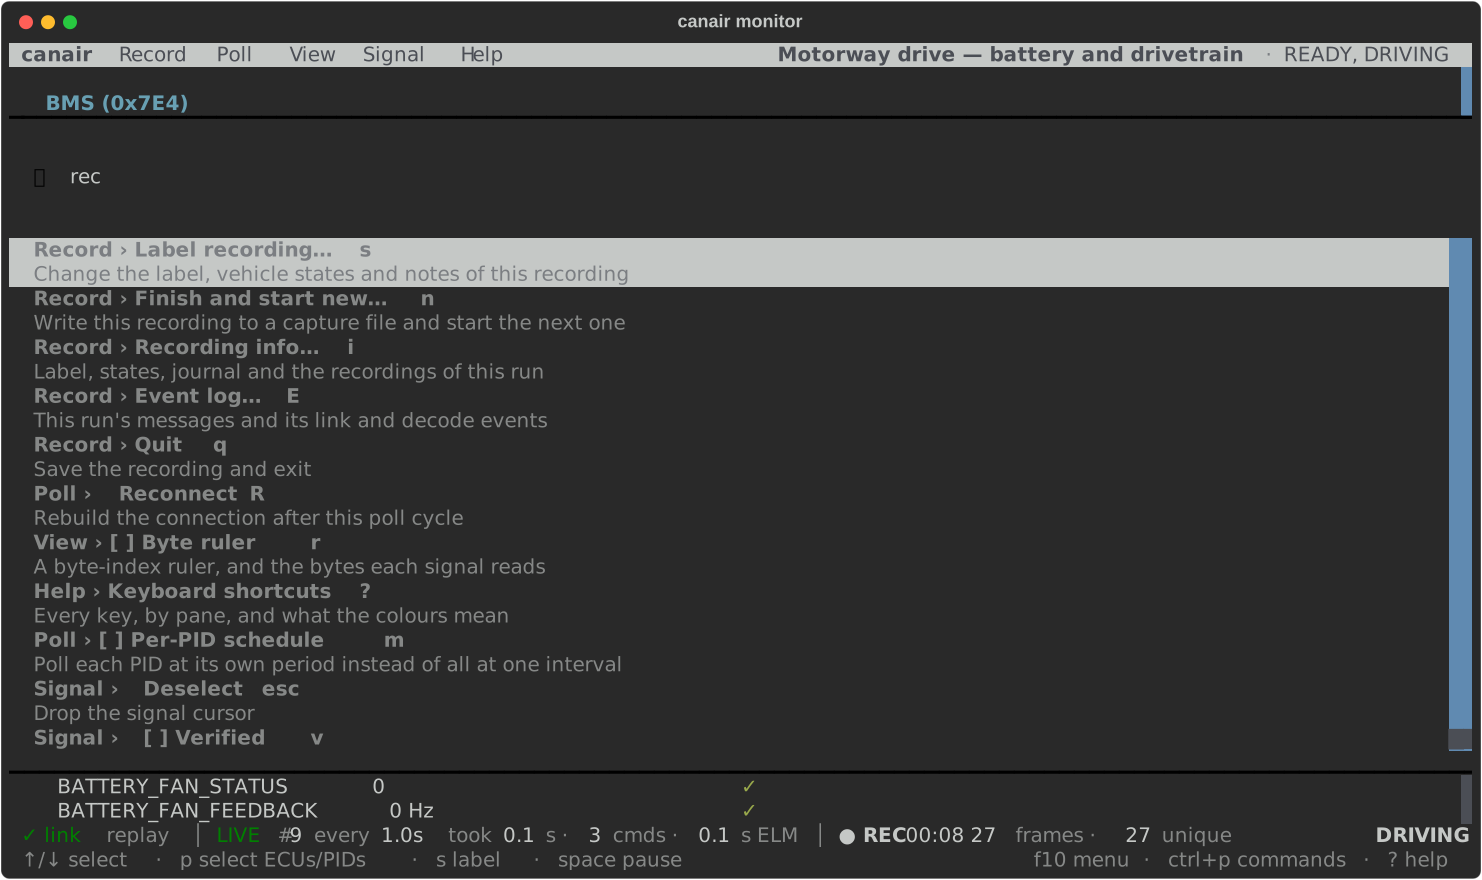
- The command palette. Press
ctrl+pand type part of a name, for examplerec,rulerorpause. Each entry shows its menu, its state and its key.
- The keys. Each menu item shows its key, so you learn the keys as you go. The most used are in Keys you use most.
The status line
The status line reports what the monitor does now, in four zones:
| Zone | Shows | Click opens |
|---|---|---|
| Link | ✓ link, or a fault: ⚠ 2 resync, ✗ 3 drops, ⟳ RECONNECTING. The device, the transport, and the round trip when it is slow. |
The event log |
| Poll | LIVE or PAUSED, the cycle (#412), the schedule, the PIDs that are polled less often, what the last cycle took |
The Poll menu |
| Recording | ● REC and how long the recording runs, or not recording; the frames captured and how many are unique |
Recording info |
| Car | An output that is on (⚠ 1 ON), the vehicle state that canair detects (DRIVING), the open diagnostic sessions (BMS 81 standard) |
The diagnostic session picker |
Only a problem is highlighted as a colored block: PAUSED, RECONNECTING, lost frames, or an
output left on. Everything else is plain text, so a colored block always means "look here".
Messages and the event log
A message replaces the context on the bottom line for a few seconds, with ✓ for a success, ⚠
for a warning and ✗ for an error. An error stays until you press a key, so you do not miss a
failure while you look away. Press E (or click the link zone) to open the event log. It
lists every message of the run, then the link and decode events of the run.
Common tasks
Choose what to poll
If you do not know what to type, run canair monitor with no arguments on a terminal. A picker
opens. The picker only reads the profile, so it works before the device is reachable.
- Tick saved groups (the
@rows, seecanair groups), individual ECUs, or both.spacetoggles a row,/filters, andctrl+aselects all or none of the visible ECUs. If you tick nothing,entertakes the highlighted row. To pick one ECU, pressenter. - Press
enterto continue. - Untick the PIDs that you do not want. Press
enterto start.
A group ticks its member ECUs and pre-selects the PIDs that it names. An ECU that you tick on its
own starts from its default sweep. escape clears the filter. A second press steps back. canair
prints the equivalent command before the monitor starts, so you can reuse it.
To change the selection while the monitor runs, press p, or choose Poll › Select ECUs and
PIDs…. The same picker opens on the PIDs that canair polls now. Add or remove ECUs and PIDs,
then press enter twice to apply the change without a restart. escape or q keeps the
selection as it was.
Record a session
Start the monitor with --save to record every poll as it arrives. canair journals the
recording to disk, so a crash or a lost link does not lose it, and writes it to a capture file
when you quit. Add --label, --state and --notes, or set them later:
s(Record › Label recording…) changes the label, the vehicle states and the notes of the recording, for everything in it.n(Record › Finish and start new…) writes the recording now and starts the next one, so one run can give several labelled recordings.i(Record › Recording info…) shows the recording, where its journal is, and the recordings that this run finished.
Without --save, nothing records yet. n (Record › Start recording…) starts a recording
from that moment: it holds every poll after the keypress, and canair writes it when you quit. Until
then, s (Record › Save snapshot…) writes a one-off snapshot of what the monitor captured so
far. Each saved recording is a capture session: canair captures uds --sessions lists them. While canair records,
it detects the vehicle state from the decoded values.
Check and edit a signal
Move the cursor over the signals with ↑/↓. The bottom line shows the selected signal and
the keys that act on it:
eopens the edit dialog: expression, unit, range, notes, verified and ship.vmarks the signal verified, or not.xincludes it in the device's AutoPID profile, or not.F(or View › …signals) shows only the verified, unverified, shipped or not-shipped signals.
canair writes the change to the profile with the same editors as canair pids, and the next poll
decodes with it. esc drops the cursor.
Change the view
V (or the View menu) steps through four views: the ECUs only, the range each signal took,
the signals, and the signals with their bytes (the default). r adds a byte-index ruler and
the bytes each signal reads. A view that is not the default shows on the bottom line.
Control the polling
By default, each PID refreshes at its own rate: twice as often as the period: that the profile
gives the PID (the WiCAN AutoPID profile uses the same period). A fast signal updates quickly, and
a slow record is read only as often as it changes. A PID with no declared period uses --interval
(default 5 s).
spacepauses polling. The values hold, and the diagnostic sessions stay open.=and-poll the whole set 1.5× faster or slower.mswitches to--schedule fixed. This reads every PID in every cycle,--intervalapart. Use it when you want an even time series of one signal for analysis.topens a diagnostic session type (10 xx) on one ECU. The car zone shows each open session.Rrebuilds the connection after the current cycle.
PIDs that stop answering
The monitor reads the ECUs one after another. A PID can stop answering. For example, a body module went to sleep, or the ECU answers the PID only in another vehicle state. A PID can also answer very slowly. In both cases, the PID delays the next read of every other PID.
The monitor detects this and polls the slow PID 2×, then 4×, up to 32× less often. It does this until the PID answers promptly again. The healthy PIDs of the same ECU keep their normal rate.
- The row of the PID says
slow (not answering) · polled 4× less often. - The poll zone lists the PID, for example
slow SKM:22B002÷4. - A reconnect restores the normal rate of every PID.
- Pass
--no-backoffto keep polling the PID at the normal rate.
If a read of a PID fails, the monitor keeps the last value. It greys the value and shows its age,
for example (stale 12s).
Switch outputs
With --actuate ECU, the monitor can switch the IOControl outputs and start the routines of
that ECU while it keeps polling. A shows the actuator pane, and tab moves between the
values and the pane. The pane lists each output and routine with its state, the readback signal
that shows its effect, and the last reply of the ECU. On a terminal of 160 columns or more it sits
beside the values; otherwise it sits below them:
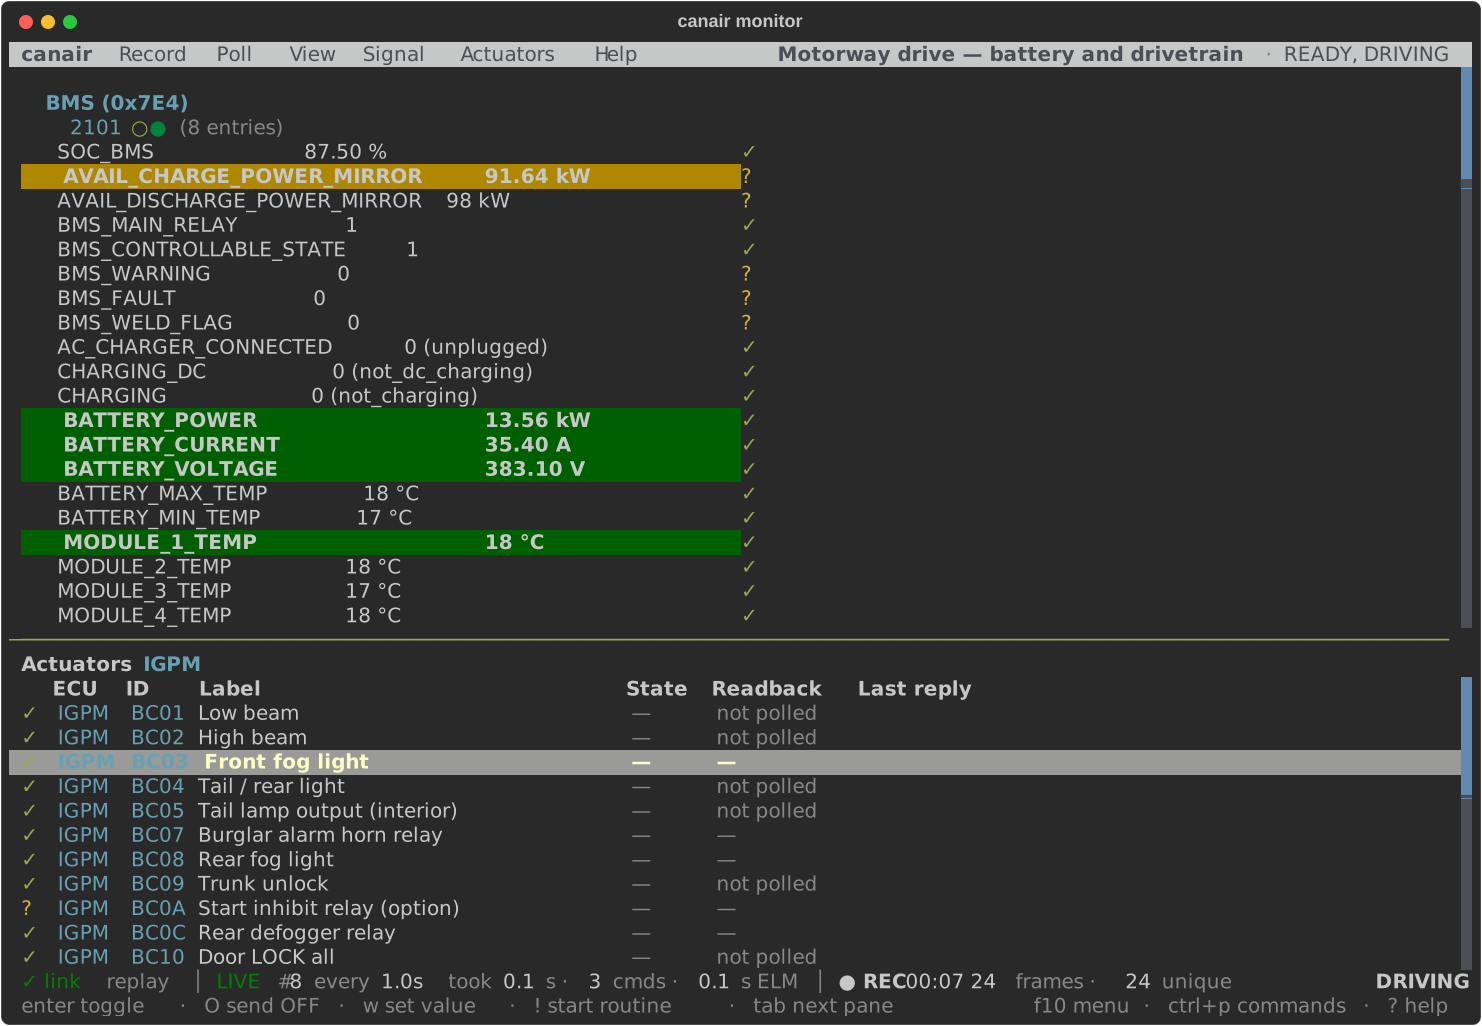
With a row selected, enter switches the output on or off, O hands it back to the ECU,
w sends a value, and ! and S start and stop a routine. The Actuators menu has
the same commands. Every output that the run switched on shows in the car zone (⚠ 1 ON), and
the monitor releases them when it exits. Read Safety first.
On a phone
The monitor works over SSH from a phone. It is designed for a phone in portrait with the keyboard up, about 45 columns by 22 rows:
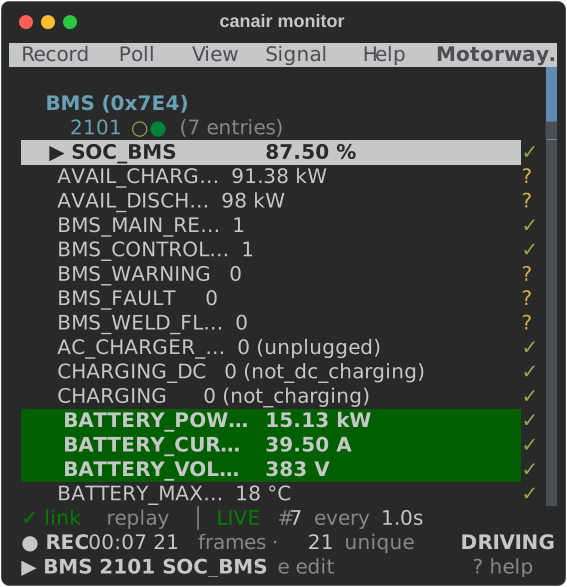
- The menu bar keeps every menu. At 45 columns the titles fit in full. On a narrower screen they
get shorter (
Rec,Sig), then become one letter each. The recording label has no room on the menu bar, so it is in recording info (i). - The status line takes two lines instead of dropping facts.
- Long signal names get shorter (
AVAIL_DISCHA…), so the value and its mark stay on the line. - A tap on a menu title or a status zone works like a click, if your SSH client sends taps as mouse clicks.
Keys you use most
| Key | Does |
|---|---|
f10 / ctrl+p / ? |
Menu bar / command palette / every key |
↑ ↓ |
Select a signal |
e v x F |
Edit / verify / ship / filter the signals |
space |
Pause or resume polling |
p |
Choose what to poll |
= - m |
Poll faster / slower / switch the schedule |
V r |
Next view / byte ruler |
s n i |
Label the recording / start the next one / recording info |
E |
Event log |
t |
Diagnostic session |
A |
Actuator pane (with --actuate) |
q |
Quit (and write the recording) |
? in the monitor is the full list, by pane. It is built from the keys themselves, so it is
always current.